Daynamica produces a continuous, minute-resolved record of each participant's activities and trips, with survey answers attached to the episodes they describe. We collect the data; your team analyzes it. Two tools help you get from the export to results.
Try it in your browser
Data Explorer
An interactive app built on the rDaynamica package. It shows how Daynamica data is structured and what the analysis steps do with it, using sample data, with nothing to install. A good first stop before you design a protocol or write an analysis plan.
An open-source R package from University of Minnesota researchers who run Daynamica studies. It covers cleaning and person-day construction, standard summary reports, calendar visualizations, chord diagrams, and activity-chain analysis, and it ships with an anonymized sample dataset.
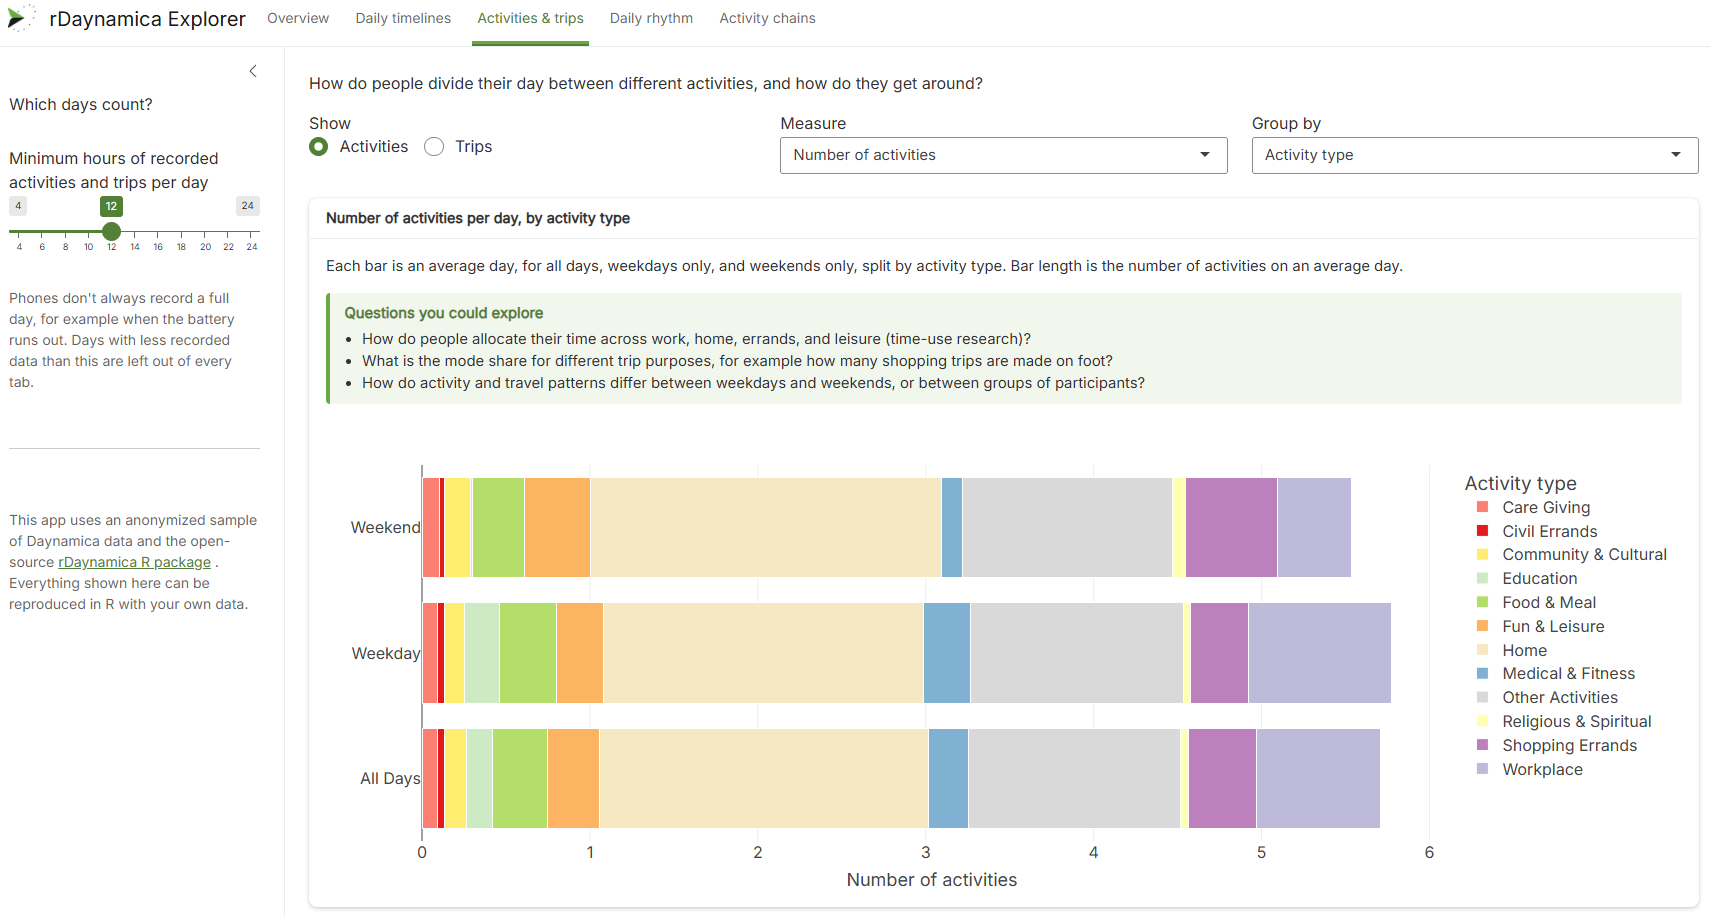
Read the rDaynamica guideThe Data Explorer's Activities & trips tab, using the anonymized sample dataset. Other tabs cover daily timelines, daily rhythm, and activity chains, and the slider on the left sets how many recorded hours a day needs to count, a decision you'll also make in your own analysis.
How the data reaches you
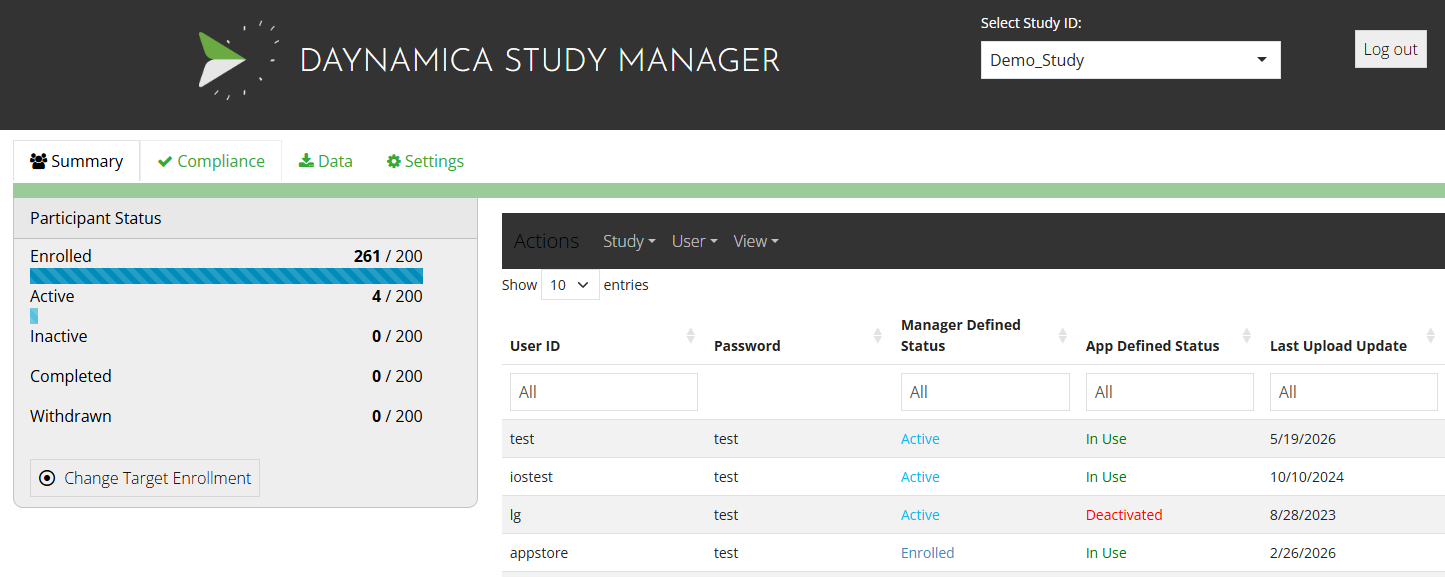
During collection, your study team uses the Daynamica Study Manager to track participation and catch problems early. When you're ready to analyze, the Study Manager's download interface exports the data. If you're collecting other participant data in Qualtrics or REDCap, we can link those sources to the Daynamica data so your exports arrive joined. Data Storage & Management has the details.
The Daynamica Study Manager, shown with a demo study.
From there, the analysis is yours. rDaynamica reads the standard export directly.
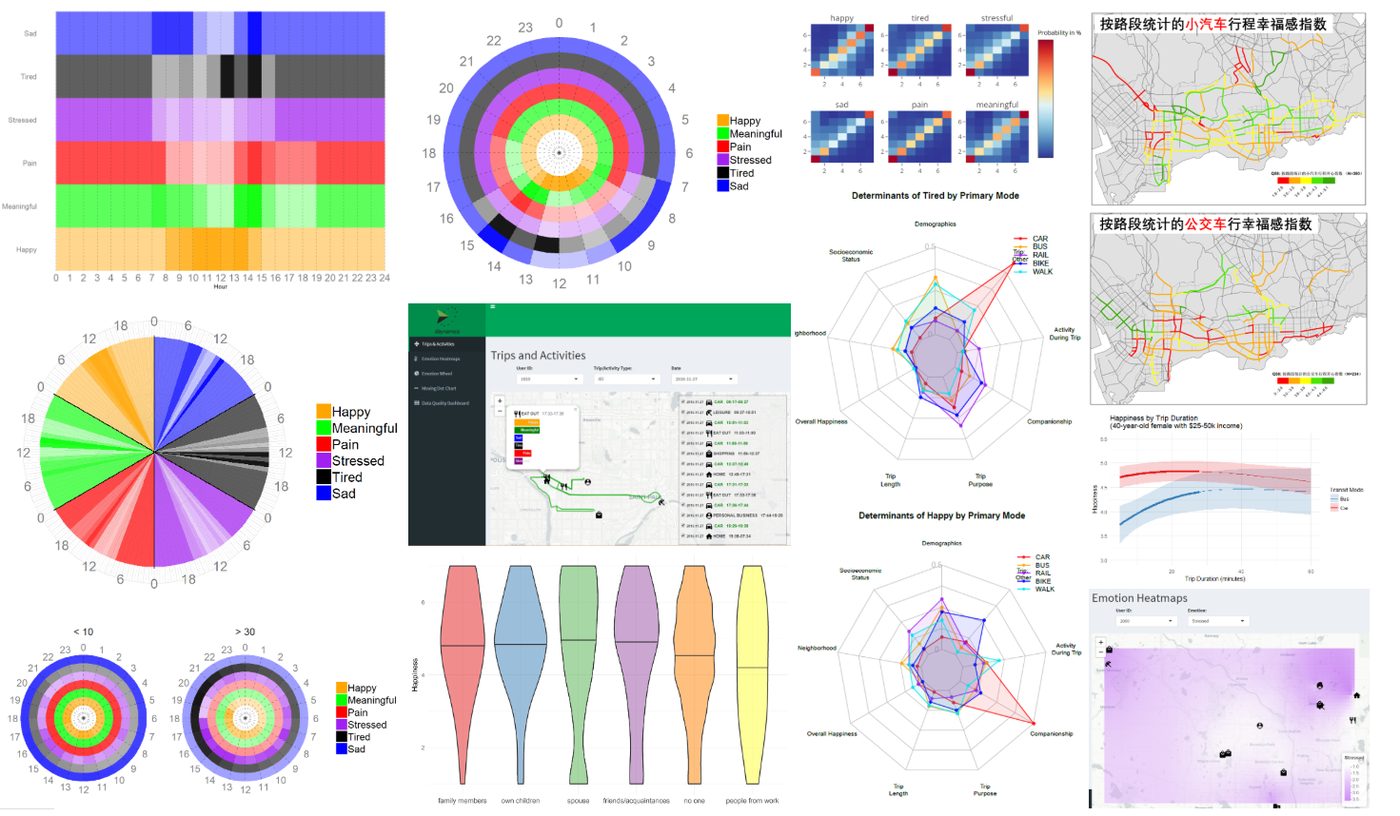
A sample of the kinds of analysis Daynamica data supports: emotion patterns by time of day, trip happiness by mode and duration, route-level mapping, and study dashboards — built by researchers using the platform, not by us.
For how other teams have analyzed their data, including statistical methods developed specifically for Daynamica-style activity sequences, see Studies & Publications.
What the export data looks like
When you download your study data from the Study Manager, it arrives as a set of relational CSV tables sharing a study prefix. Because files are exported in standard CSV format, your team can load them directly into R, Stata, SAS, SPSS, Python, or relational databases without proprietary converters.
1. Episodes (ucalitems)
Minute-resolved records for every detected and confirmed episode, including start and end timestamps, durations, activity subtypes (such as HOME or WORK), trip modes (such as CAR, BUS, WALK), distances, and confirmation status.
2. Episode Surveys (calendar_item_survey)
Answers to in-app questions triggered by or attached to specific activities and trips (such as travel companions, trip purpose, or subjective well-being ratings). Joins directly to episodes via calendar_item_id.
3. Scheduled Surveys (ema_survey)
Ecological Momentary Assessment (EMA) or end-of-day survey questions that are not bound to a single episode, keyed by participant ID and timestamp.
If your protocol includes survey instruments collected in REDCap or Qualtrics, we can link identifiers so your exports arrive joined to the sensor episodes. To see how these tables feed directly into reproducible analysis scripts, explore the rDaynamica guide or test the bundled sample dataset in the Data Explorer.
Planning a study? Start with the analysis
Knowing how you'll analyze the data shapes the protocol: how many days to collect, which surveys to attach to which episodes, and what counts as a valid day. Settle those before collection starts.
 DAYNAMICA