DAYNAMICA Request a quote

What a day looks like when you measure all of it

Daynamica turns phone sensor data into a continuous, annotated record of where someone went, how they got there, and how they felt along the way. Below are the studies that have used it, what each one measured, and the papers that came out of them.

Browse all 51 publications, reports, and theses
Home Work or school Medical care Leisure Errands Travel
Five participant-days as Daynamica records them: continuous, minute-resolved episodes with travel segments between them, each one open to a survey prompt.
Filter by field
11 studies
Health Collecting data
Protocol
28 consecutive days
Population
Adults in active cancer treatment
Instruments
Episode capture, daily well-being surveys, baseline and follow-up surveys
Funding
NIH/NCI R01CA277714; NIH STTR R41CA271962
Partners
University of Minnesota Masonic Cancer Center
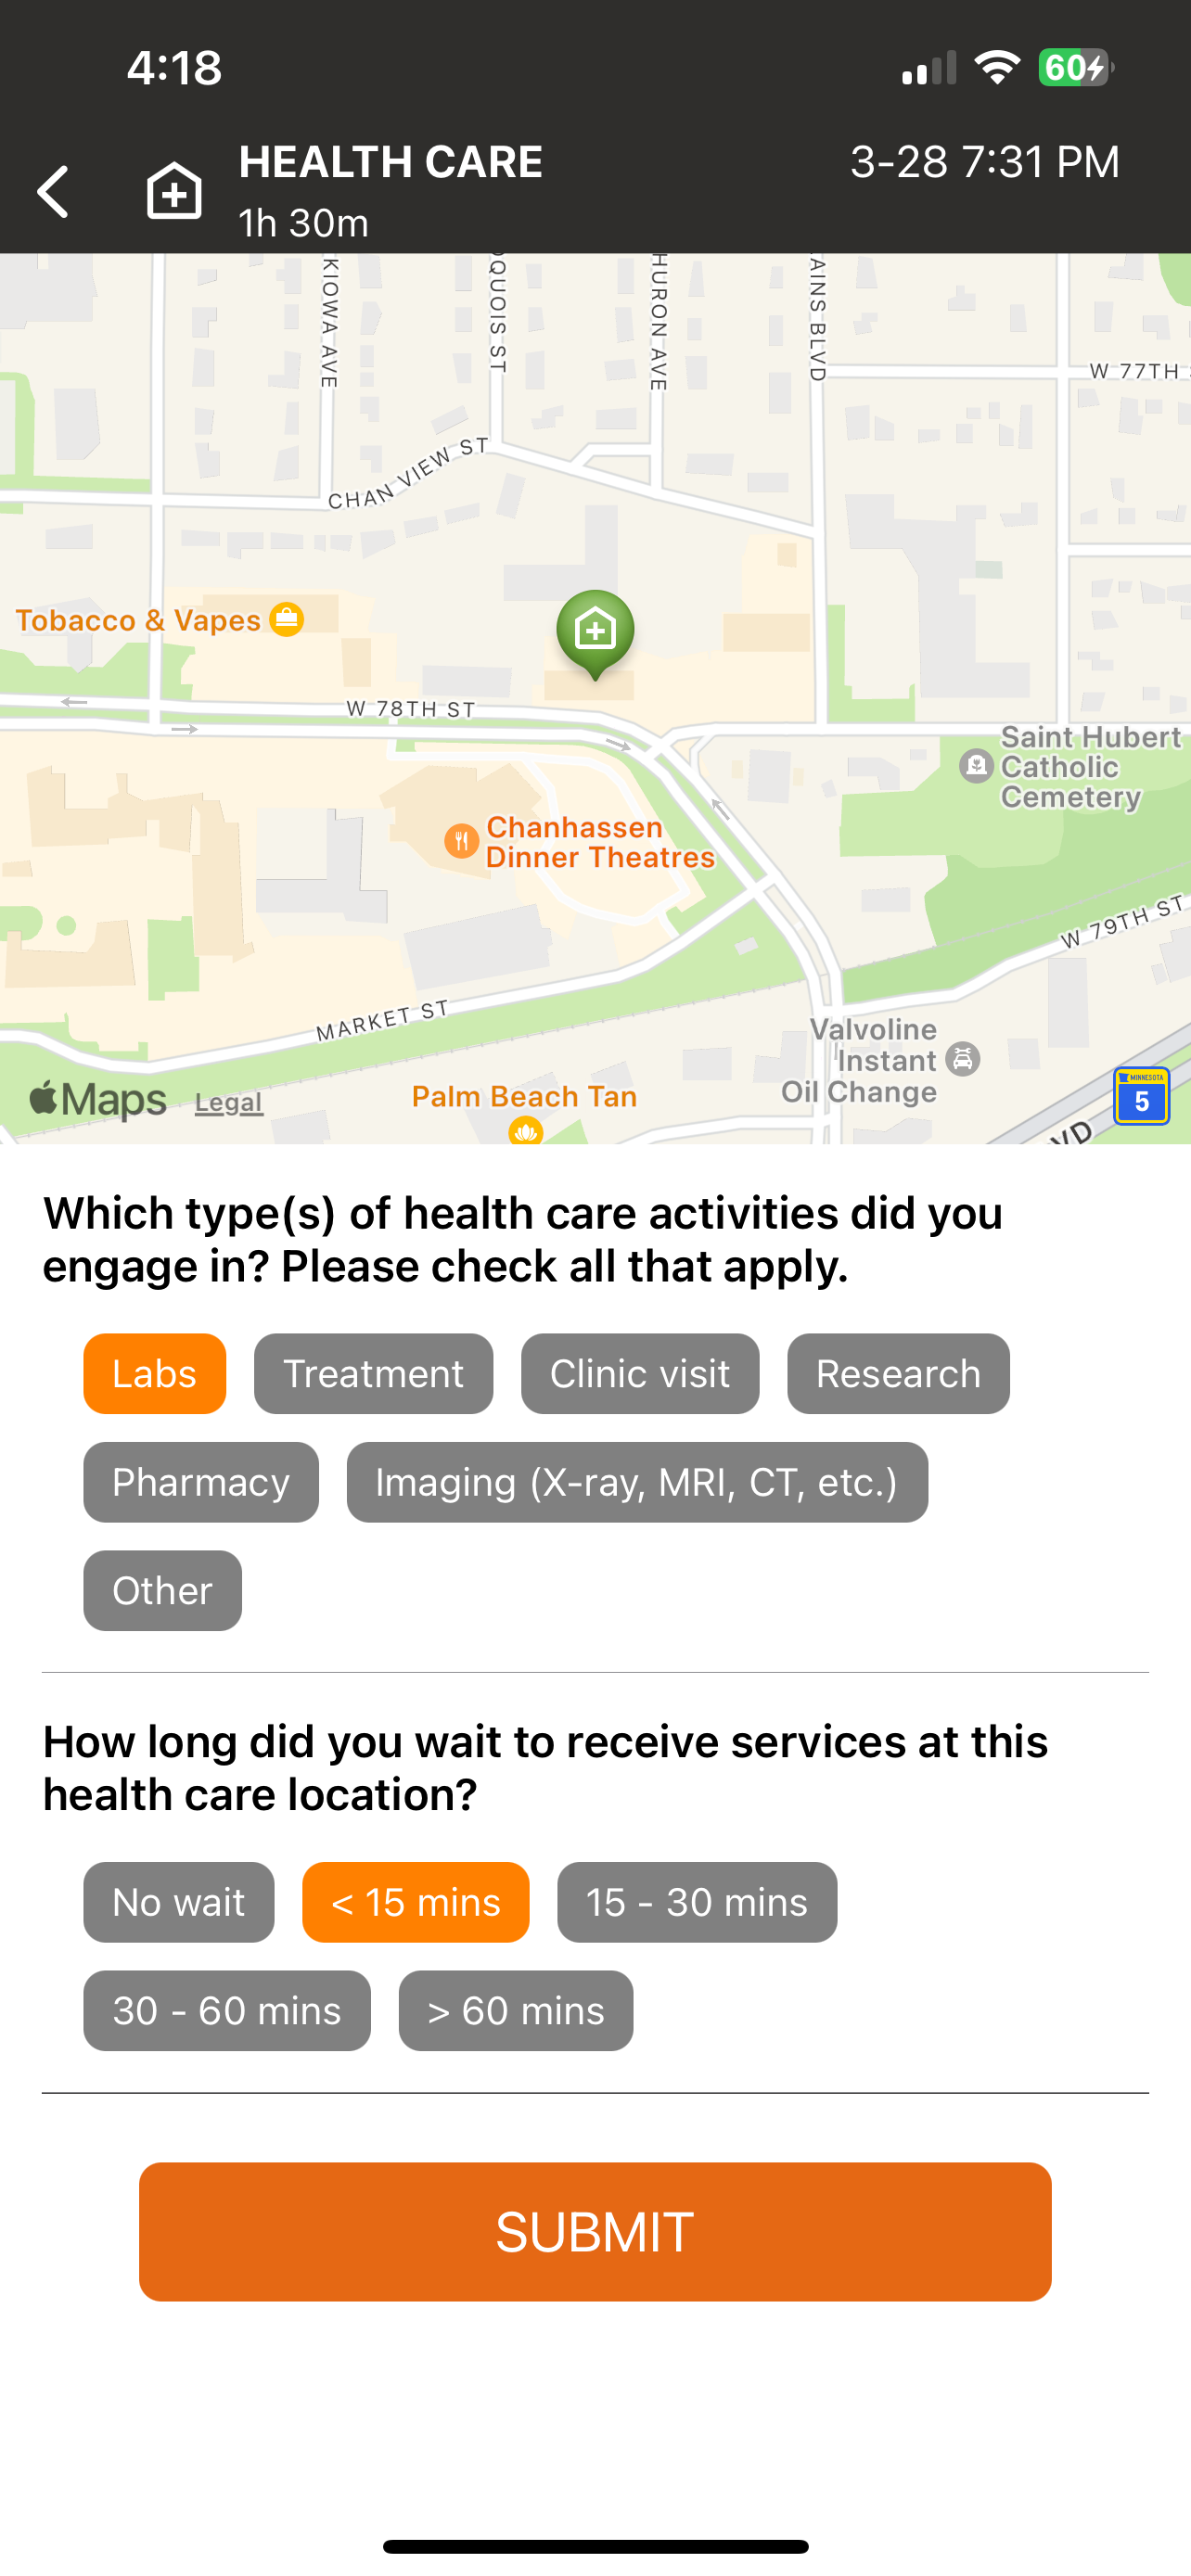
Daynamica app survey for a health care episode, asking which types of care the participant received (labs, treatment, clinic visit, research, pharmacy, imaging, or other) and how long they waited, from no wait to more than 60 minutes.
An in-app survey attached to health care episodes.

Measuring the time toxicity of cancer care

Cancer treatment consumes time in ways the medical record never captures: the waiting, the parking, the two-hour round trip for a twenty-minute infusion, the pharmacy calls made from a work desk. Because none of it is counted, care models get chosen without anyone weighing what they cost patients and families in hours and energy.

This project is building an app-assisted day reconstruction method that quantifies those burdens directly, so oncologists and hospital administrators have something concrete to design against.

What Daynamica contributes Participants carry their own phone for four weeks. The app detects each activity and trip, then asks them to confirm it and tag whether it was cancer-related — separating treatment time from the rest of life without asking anyone to keep a diary.
Environment Collecting data
Research group
Minnesota Population Center, University of Minnesota
Lead
Samantha Gailey
Linked data
Green- and blue-space measures along travel routes
Status
Ongoing

Moving greenspace research from the census tract to the route

Greenspace exposure has conventionally been measured at the census-tract level around someone's home — a static, residence-anchored proxy that ignores the fact that people move. Two neighbors with identical tract-level greenness can have completely different days.

What Daynamica contributes GPS-derived trajectories make exposure a realized quantity rather than an assumed one. Gailey's group links each participant's routes to green- and blue-space measures and joins them to trip-level happiness reported in the app, so exposure and affect are measured on the same timeline.
EnvironmentMethods Collecting data
Research group
Human Bio-Behavioral Signals (HUBBS) Lab, Texas A&M University
Lead
Jinwoo Kim
Linked data
Wristband bio-signals (electrodermal activity, heart rate) and phone motion sensors
Status
Published 2023; work continuing with older adults

Using pedestrians as sensors for street-level stress

Walkability is normally scored by an auditor with a checklist: is the sidewalk blocked, is the surface uneven, is there trash. It's a reasonable proxy, but it measures the street rather than the experience of walking down it, and it can't tell you which of those conditions actually register on the people passing through.

What Daynamica contributes A customized version of the app detects each walking trip and then asks the participant to mark, on the route map, where they felt distress and what caused it. That georeferenced walking episode is what the wristband bio-signal stream is aligned to, so physiological arousal can be attributed to a specific stretch of sidewalk rather than to a whole trip.
Health
Sample
68 health care workers
Observation
1,929 participant-days across two one-month waves
Outcome data
Self-reported stress and physical health
Status
Complete; analysis continuing

COVID-19 exposure and stress among front-line health care workers

Health care workers absorbed an extraordinary burden during the pandemic, and almost none of the available data could distinguish what happened to them at work from what happened in the rest of their lives. Exposure indices built from job title alone miss the commute, the grocery run, the second job.

What Daynamica contributes Continuous episode capture over two month-long waves produced in-work and out-of-work exposure indices for each participant, which could then be correlated with the stress and health measures they reported in-app.
  • Results in preparation.
Health
Population
Breast cancer survivors
Research group
School of Kinesiology, University of Minnesota
Measures
Trip-level emotion, physical activity, psychosocial beliefs
Status
Published 2022

Daily movement and mood in breast cancer survivors

Survivorship guidelines recommend physical activity, but adherence is measured with recall questionnaires that ask people to reconstruct a typical week. For a population managing fatigue, that recall is exactly the thing least likely to be accurate.

What Daynamica contributes Emotion surveys fire at the end of each detected trip, so responses are anchored to a specific journey while it's still fresh. The group found survivors reported more happiness and less fatigue on walking trips than car trips — a within-person comparison that a weekly recall survey cannot produce.
Transport
Sample
350 residents, Minneapolis–St. Paul
Protocol
7 consecutive days
Measures
Six emotions per episode, plus companionship and purpose
Status
Published; dataset reused in urban-infrastructure and statistical-methods work

Trip happiness across modes, purposes, and companions

Transportation planning has good data on how long trips take and almost none on what they feel like. Trip happiness — emotional well-being measured during travel rather than remembered afterward — turns out to vary systematically with mode, purpose, duration, time of day, and who you're with.

What Daynamica contributes The app detects each trip and then asks about it, which means the emotion rating is attached to a known origin, destination, mode, and duration without the participant entering any of that. Biking and walking trips, trips for eating out and leisure, daytime trips, trips with family or friends, and trips of 15 to 30 minutes all scored higher.
Transport
Population
Daily parking contract holders, University of Minnesota
Design
Observation followed by in-app intervention
Measures
Mode and route capture, plus willingness-to-switch surveys
Status
Complete
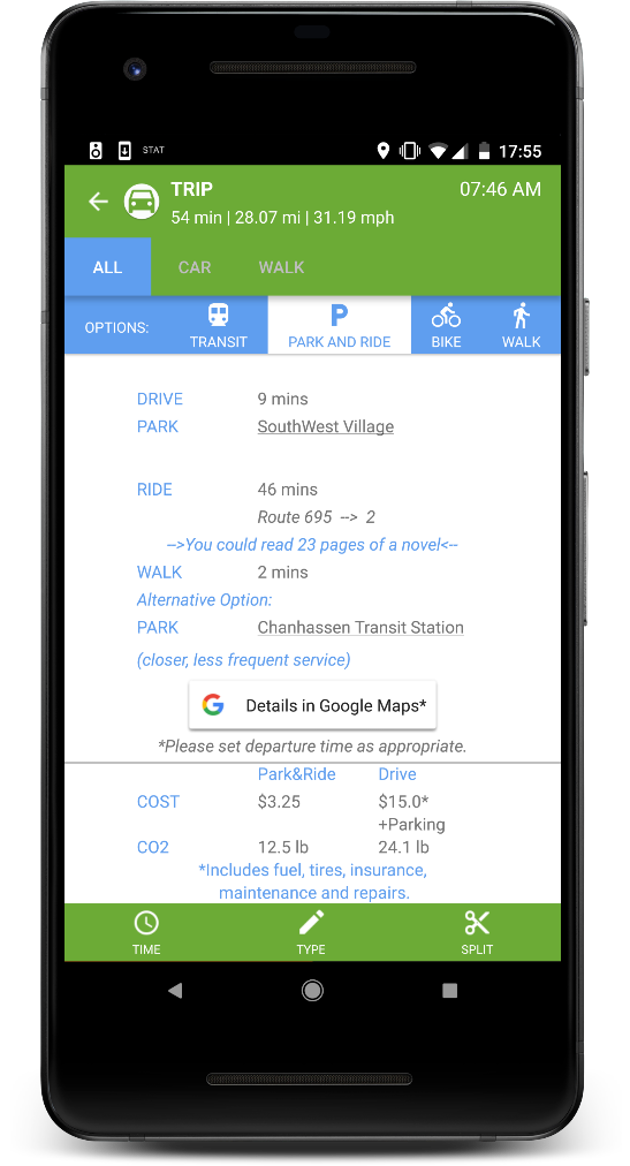
Daynamica app showing a 54-minute car trip with alternatives for the same journey: transit, park and ride, bike, and walk. The park-and-ride option lists a 9-minute drive, a 46-minute bus ride, and a 2-minute walk, with a cost and CO2 comparison against driving.
An in-app alternative to a trip the participant actually drove.

Testing a mode-shift nudge on committed drivers

The Travel Options Project targeted the hardest group to move: people who had already bought a parking contract and drove every day. Understanding their commutes was the first half of the problem. The second was finding out whether a well-timed, personally relevant alternative would land.

What Daynamica contributes The app registered each participant's real travel pattern, then served transit recommendations matched to trips they had actually made. Built-in surveys captured whether they would consider the alternative — turning the same instrument into both the measurement tool and the intervention channel.
TransportEnvironment
Sites
Three U.S. metropolitan areas
Field period
Fall 2016 – Spring 2018
Instrument
Travel Mood Scale, administered in-app at trip end
Status
Published 2017–2020

How built and natural environments along a route shape mood

Most travel-satisfaction research captures a single retrospective rating per person, which makes within-person variation invisible and leaves no way to connect mood to the specific places someone passed through.

What Daynamica contributes The team added the Travel Mood Scale to the app as a custom end-of-trip survey — an example of the survey engine being extended to carry a validated external instrument. Because each response is tied to a full route trace, mood could be modeled against the built and natural environment along the way. Walking and biking trips scored higher; conversation during a trip helped; errand trips scored lower.
EnvironmentTransport
Sample
370 residents, Minneapolis–St. Paul
Research group
Anu Ramaswami, Kirti Das, and Yingling Fan, University of Minnesota
Linked data
Household and neighborhood infrastructure, air quality, built environment
Status
Published 2019–2026

Urban infrastructure and everyday well-being

Cities invest in parks, gardens, transit, and cleaner air partly on the promise that they make life better, but the evidence usually rests on a single survey question about life satisfaction. That says little about which parts of the day an investment actually touches.

Working from the same Twin Cities sample as the trip happiness study, this group linked how people felt during specific activities to the infrastructure around them: gardening at home and in community plots, local air quality, and the street and land-use features that encourage walking and biking or drive up travel emissions.

What Daynamica contributes The app-based day reconstruction method records how people felt during each activity and trip, not just how they rate their lives overall. That makes it possible to compare well-being across activities, such as gardening against other leisure, and to set episode-level feelings alongside the life-evaluation measures cities more often use.
Transport
Research group
Yingling Fan and Ying Song, University of Minnesota
Projects
Centering the Margins; Advancing Equity in Accessibility and Travel Experiences; COVID-19 and public transportation
Funding
Equity project: Minnesota Department of Transportation and Federal Highway Administration
Status
Reports published 2022–2023

Whose trips count: equity, identity, and pandemic travel

Transportation plans are built on travel surveys that undercount the people for whom getting around is hardest, and that record where people went but not what the trip was like. Those gaps fall hardest on underserved communities, on women and gender minorities, and on the transit riders whose options shifted during the pandemic.

What Daynamica contributes Because the app detects trips automatically and asks short questions about each one, participants don’t have to keep a diary, which lowers the burden for people with the least time to spare. The resulting record of every trip, with how it felt, lets researchers compare access and travel experience across groups rather than assume them from averages.
Methods
Research group
Division of Biostatistics, University of Minnesota
Problems
Clustering, synthesizing, and summarizing activity sequences; individualized inference
Venues
JASA, JCGS, Biostatistics, Statistics in Medicine
Status
Published; three doctoral dissertations

Statistical methods built for Daynamica-shaped data

A Daynamica day is a sequence of categorical states at minute resolution — a data structure that most off-the-shelf analysis tools handle badly. Sequence-alignment approaches to clustering become expensive fast and produce results that are hard to interpret.

Biostatisticians at the University of Minnesota have built a set of methods for exactly this kind of data: fast, interpretable clustering of activity days; synthetic sequences that mimic real participants for sharing and simulation; dimension reduction that finds the times of day that separate one pattern from another; and Bayesian borrowing that sharpens estimates for a single participant by learning from similar ones.

Why this matters if you're evaluating the platform Daynamica data has attracted enough statistical attention that purpose-built methods now exist for it, published in top-tier venues and, in some cases, accompanied by working code. You are not the first person who will have to figure out what to do with the output.

Planning your own study?

Two places to go next, depending on where you are.

Writing a proposal

Budget figures, IRB and privacy language, data management details, and letters of support — what reviewers ask about, gathered in one place.

Grant-writing support

Working with the data

How exported data reaches your team, plus two tools: the Data Explorer for trying Daynamica data in your browser, and rDaynamica for analyzing it in R.

Working with Daynamica data

Tell us what you're trying to measure

Most conversations start before the grant is written. Send us the design you have in mind and we'll tell you honestly whether Daynamica fits it, what the protocol would look like, and what it would cost.