Sensing that runs quietly in the background of someone's real life
Traditional methods for collecting time use, activity, and travel behavior data are cumbersome, putting excessive burden on study participants. Daynamica leverages cutting-edge mobile sensing to automatically capture highly granular digital trails of human mobility and daily experiences with minimal user burden.
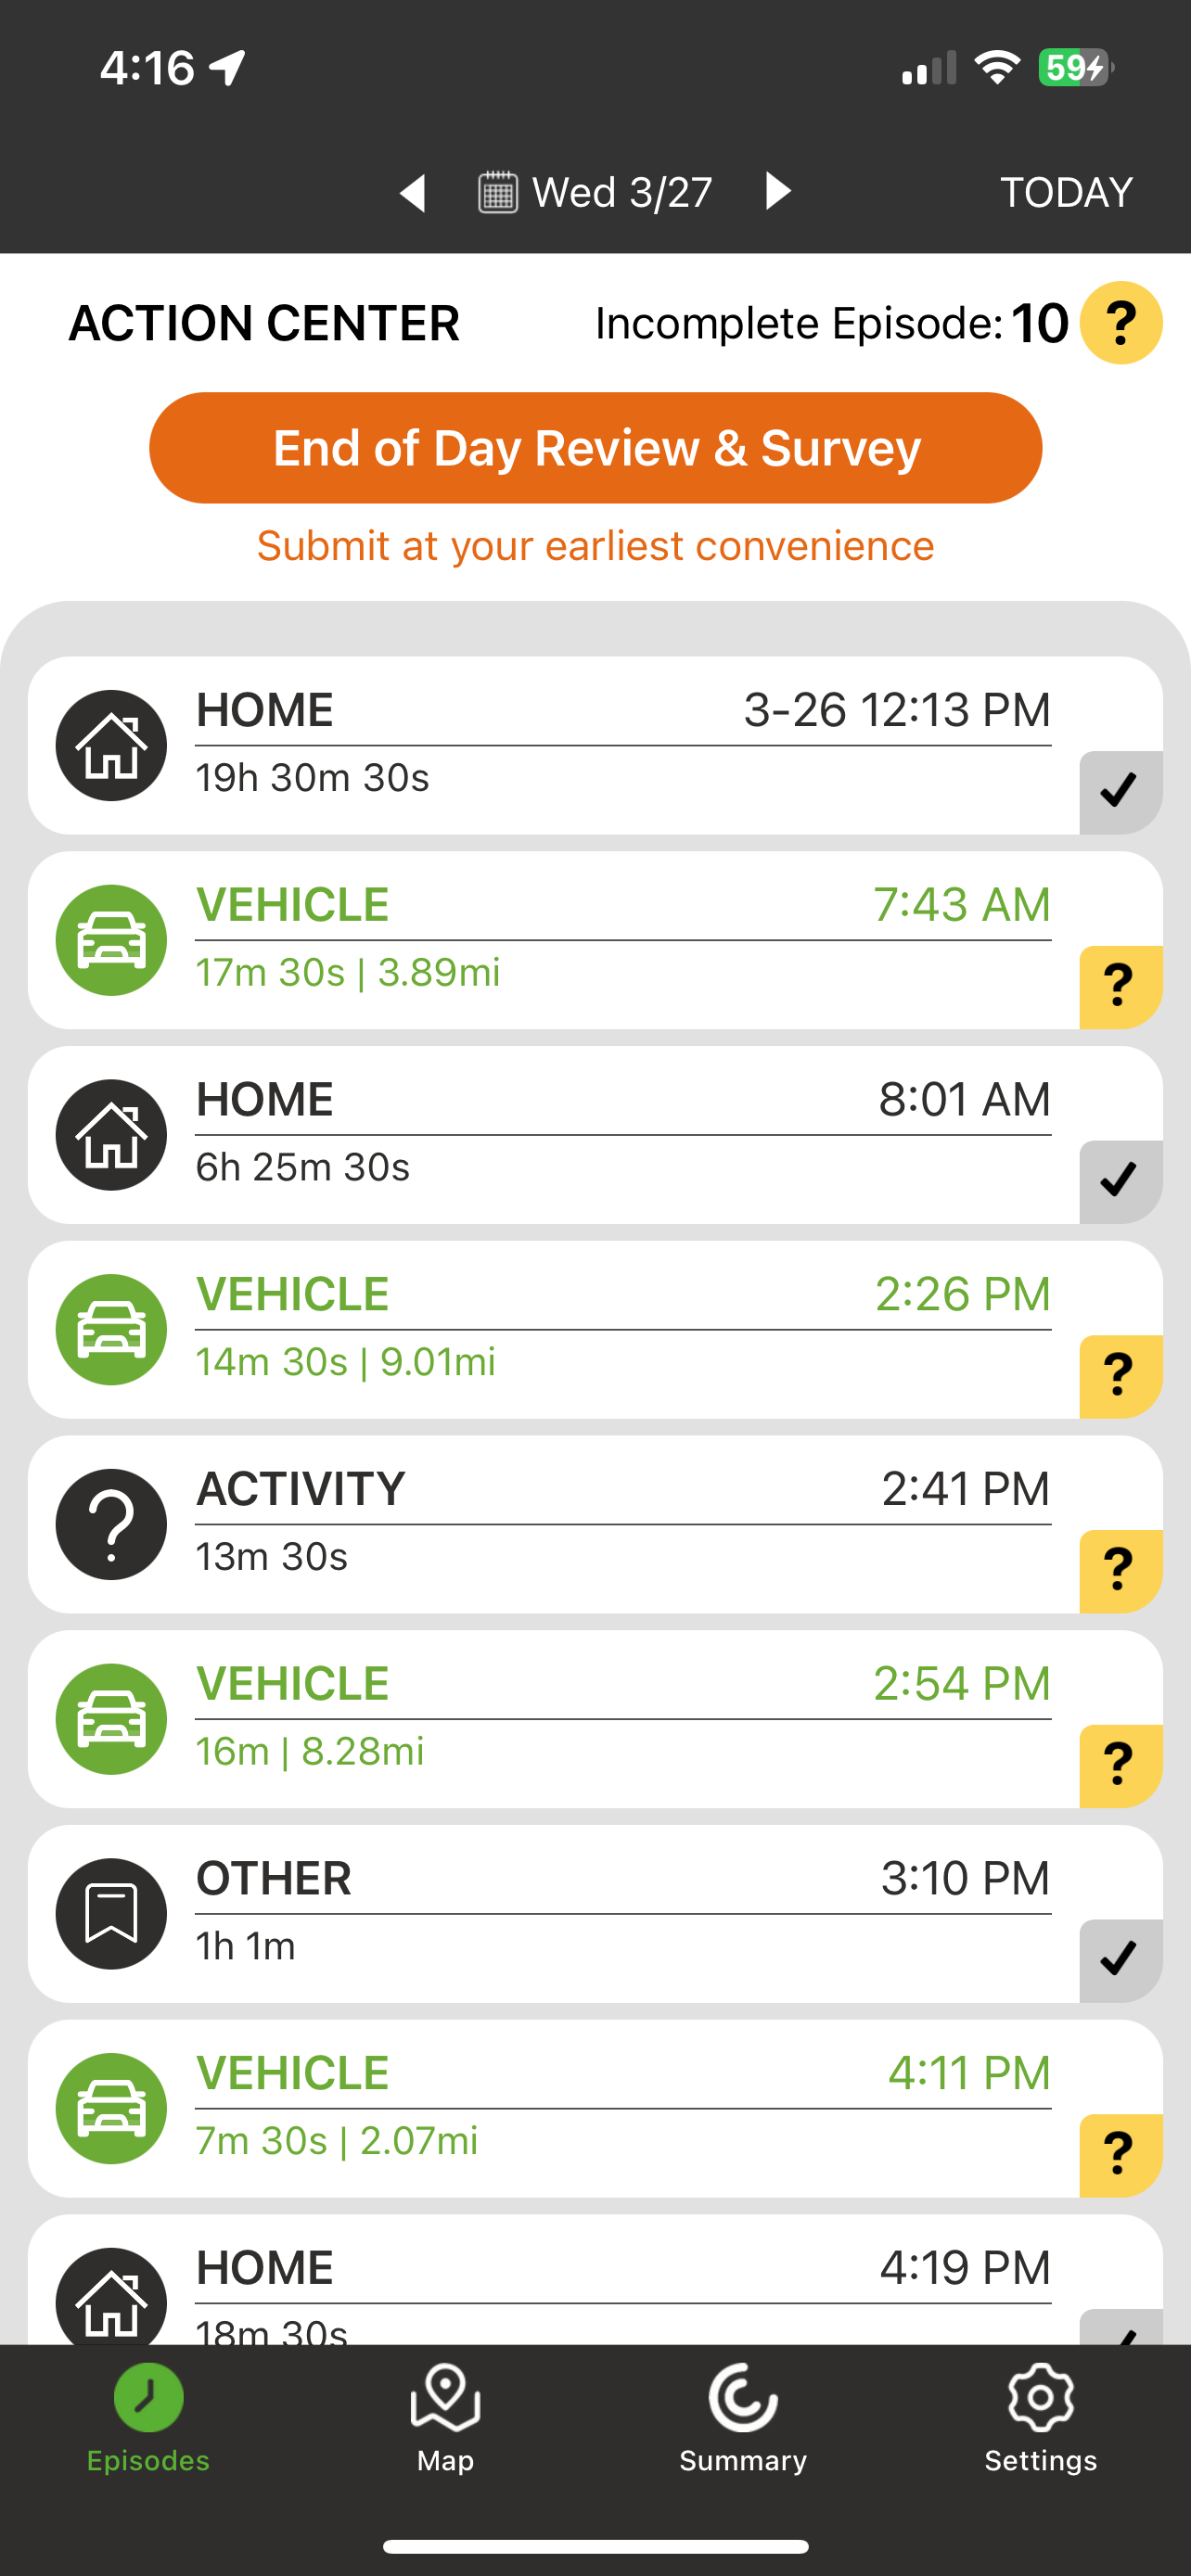
Our research-grade smartphone application discreetly collects precise details on activity patterns, travel behaviors, and environmental contexts that shape real-world decisions and outcomes. Both iOS and Android versions provide seamless, passive data collection tailored to each study's requirements. The app detects each activity and trip on its own; participants see what it found and add what sensors can't know, such as purpose, companions, or how they felt.
Why researchers choose Daynamica
Comprehensive data. Daynamica captures many more dimensions of travel behavior data than either travel surveys or GPS sensing alone.
Lower respondent burden. Because it automatically collects data on several trip attributes, Daynamica puts a much lower time burden on respondents than traditional travel survey methods, and participants don't need to carry any extra device.
More accurate data. Because users can see trip information derived from sensor data before entering additional information, Daynamica minimizes recall bias and reporting errors.
Richer data. Lower user burden lets you lengthen the study period from a typical day to a week or more, enabling analysis of weekday/weekend differences and other variation.
Reduced post-processing and cost. Daynamica collects and processes data in real time, locally on the smartphone, reducing the post-processing burden on your team.
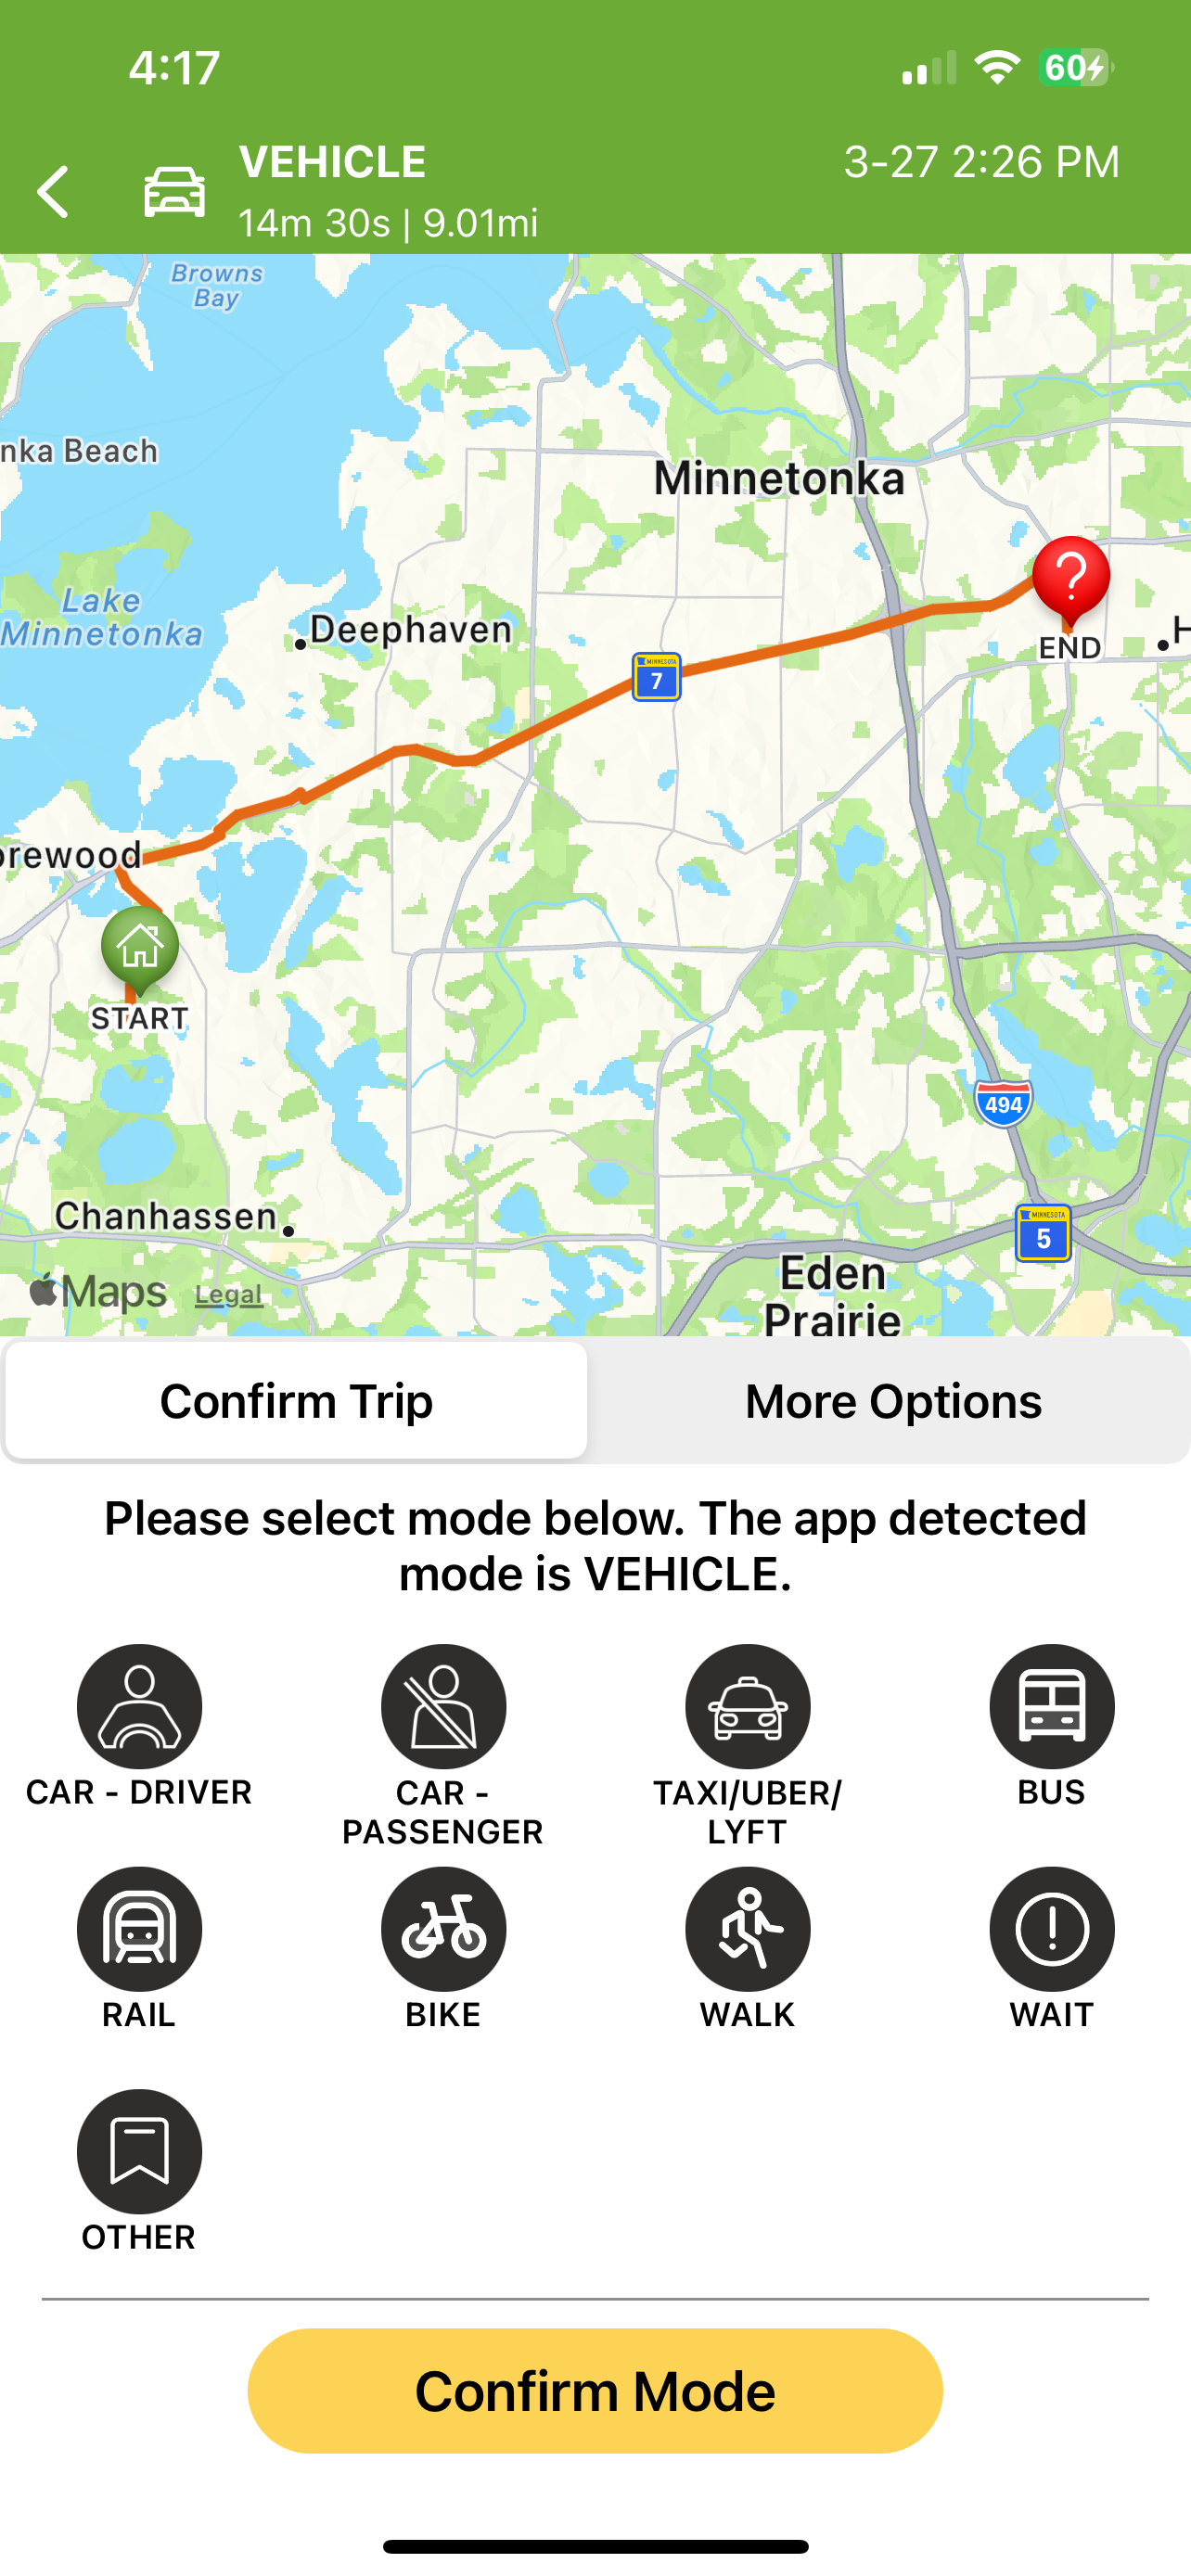
A detected trip, ready to confirm. The app shows what it detected; the participant picks the exact mode, and More Options handles anything else that needs fixing.
Customizing it for your study
Daynamica's platform can be customized for research settings investigating the impacts of the built environment, transportation systems accessibility, urban design influences, neighborhood and environmental effects on health behaviors, and more. Surveys can be attached to specific kinds of episodes, such as the end of each trip, and can carry validated instruments from your field.
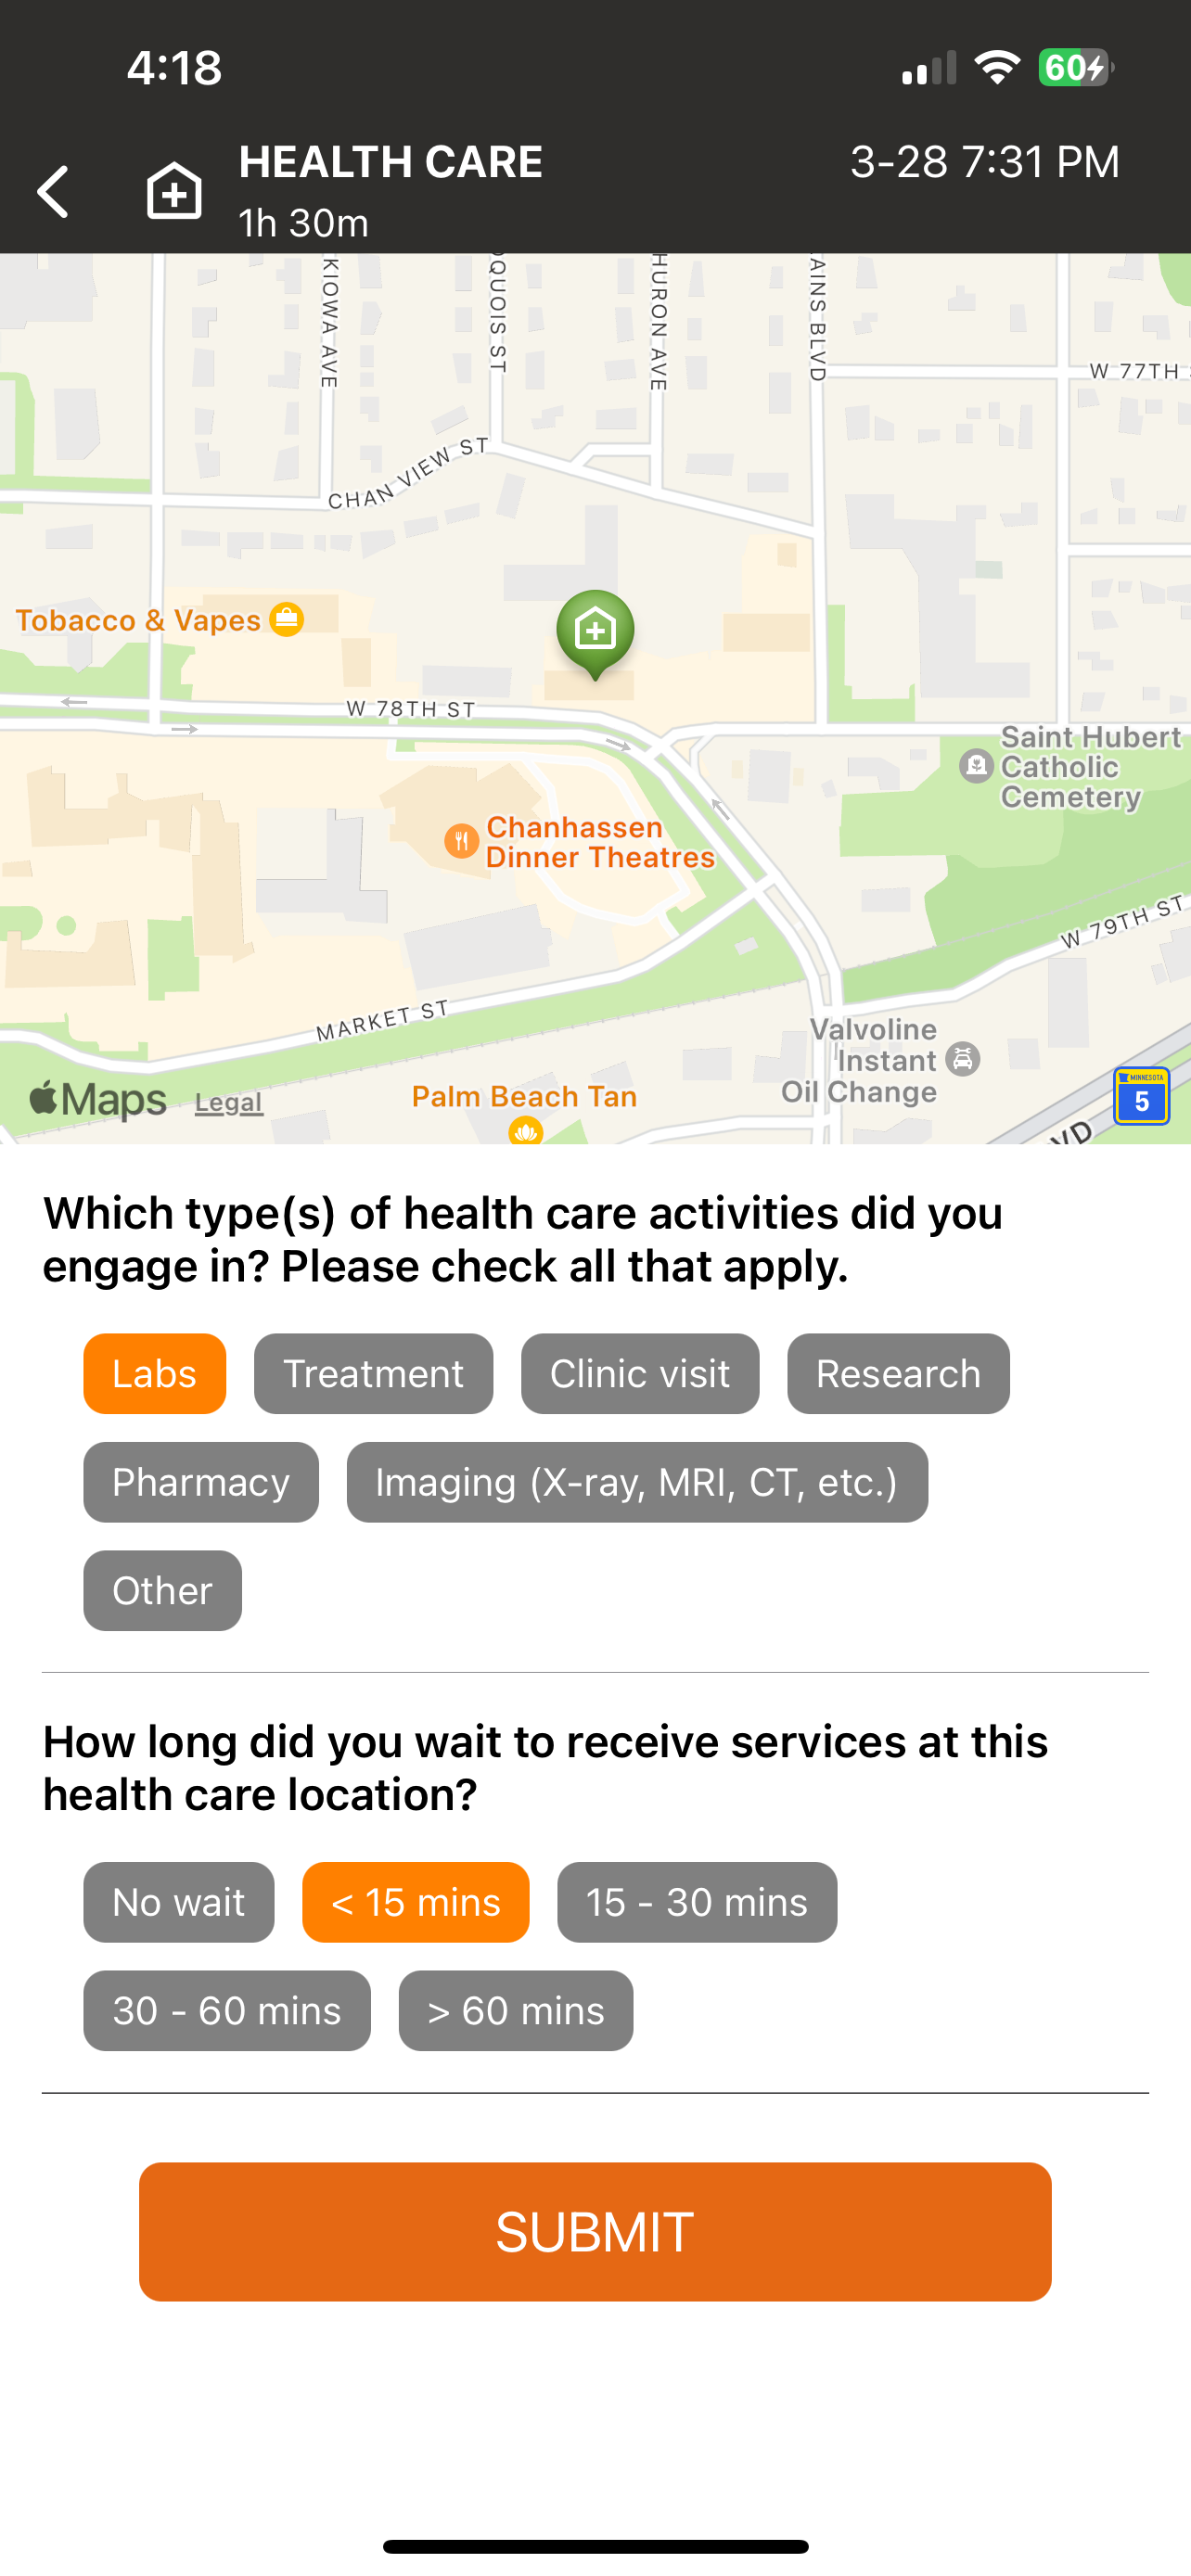
In the time toxicity of cancer care study, for example, health care episodes prompt questions about what kind of care it was and how long the participant waited. Answers arrive already attached to the visit's time, place, and duration.
A survey that appears only for health care episodes, asking about the type of care and the wait.
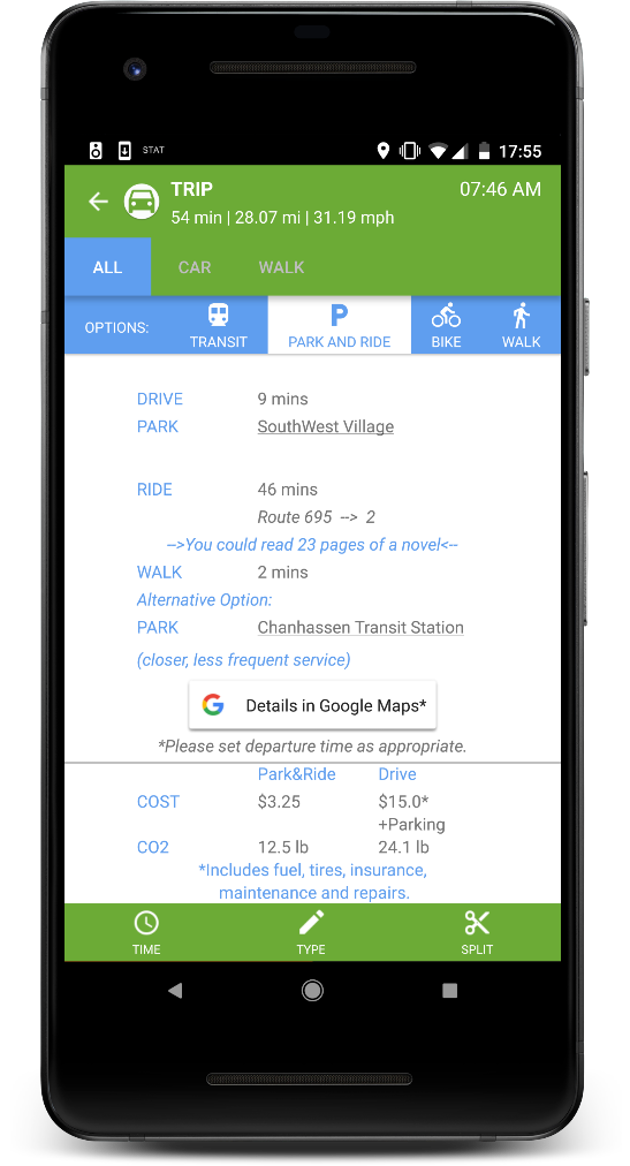
Our technologies also enable delivering personalized just-in-time interventions triggered by objectively observed contexts and behaviors. In the University of Minnesota's parking contract holder study, for example, the app took car trips participants had actually made and showed them a transit, park-and-ride, bike, or walking alternative for that same trip, with its time, cost, and emissions.
An in-app intervention: alternatives to a trip the participant actually drove, with time, cost, and emissions side by side.
Wearable sensor integrations
We can work with you to build custom integrations that capture data from wearable sensors, link it with data from the Daynamica app, and store it securely on the cloud — for example, our integration with the Empatica E4 wristband.
Specifications
Platform capabilities & technical matrix
A granular breakdown of Daynamica's technical architecture, on-device capabilities, and researcher tools for protocol planning.
Sensors & ML
Sensing & Detection Engine
Core Sensor Fusion
Combines GPS and 3-axis accelerometer readings to detect movement episodes with minimal battery drain (<10% typical daily battery use).
Automated Mode Inference
Differentiates motorized trips (car, bus, rail) from active transport (walk, bicycle) and stationary dwell times in real time.
Participant Confirmation Ground-Truth
Participants review detected episodes, confirm or correct transport modes, and resolve ambiguous dwell episodes in 1–2 minutes per day.
Self-Learning Location Tagging
After 5–7 days of participant location tagging, recurring places (home, work, clinics) are classified automatically with >90% passive accuracy.
Instruments
Survey & EMA Engine
Episode-Triggered Surveys
Triggers micro-surveys bound to specific activity types or trips immediately upon completion (e.g., healthcare visits, commutes).
Scheduled & Time-Window EMA
Delivers scheduled Ecological Momentary Assessments or evening end-of-day reviews with customizable notification windows.
Validated Scales & Custom Logic
Supports validated psychometric and quality-of-life instruments (Likert, VAS, multiple choice, conditional branching).
Participant Autonomy & Pausing
Participants can pause tracking anytime from settings for private appointments or unpair permanently without breaking study integrity.
Infrastructure
Resilience, Peripherals & Architecture
Store-and-Forward Offline Cache
Full local SQLite caching stores weeks of sensor data when offline; uploads automatically upon Wi-Fi or cellular reconnection.
Wearable Sensor Linking
Supports custom telemetry integrations (e.g., Empatica E4 wristbands, BLE heart rate/EDA loggers) synced to the same timebase.
Multi-Tenant Study Manager
Web-based research coordinator portal with real-time sync indicators, compliance tracking, role-scoped permissions, and cohort alerts.
Relational Analysis Exports
Exports relational CSV tables (ucalitems, calendar_item_survey, ema_survey) with direct compatibility with rDaynamica, Python, Stata, and REDCap.
Implementation
Study setup & coordinator workflow
From initial protocol configuration to daily data verification, here is how graduate students, study coordinators, and lab staff operationalize Daynamica in the field.
1
Protocol & Taxonomy Definition
Configure activity and trip types to match your research domain.
Work with the Daynamica team during study onboarding to establish your custom activity taxonomy, validated survey instruments, episode trigger rules, and cohort tracking windows.
2
Participant Provisioning & Onboarding
Zero-friction participant setup on iOS and Android.
Participants download Daynamica from the App Store or Google Play, authenticate using a pseudonymized study ID, and complete simple one-time background location and battery permission setup.
3
Fieldwork & Real-Time Quality Monitoring
Track compliance without waiting for study close.
Research assistants monitor incoming data via the Study Manager dashboard. Flag non-syncing phones, verify compensation thresholds, and spot protocol compliance drops early.
4
Relational Data Export & Analysis
Instant access to clean, person-day structured datasets.
Export relational CSV tables whenever needed. Join participant responses to Qualtrics/REDCap registries, or run automated cleaning and reports with the open-source rDaynamica R package.
Where the data goes
Complementing our data collection capabilities, Daynamica provides an integrated suite of secure cloud tools for data storage and study management: a data quality dashboard for your study team during collection, and exports for analysis when it's done. See Data Storage & Management for details, or inspect the export data schema.
Participants with questions about battery, data use, or privacy can start with the Participant FAQ.
See it running against your study design
Tell us your population, protocol length, and any wearables you're already using. We'll walk through your protocol and tell you exactly how the app would capture it.
 DAYNAMICA